Infographic Designs

Project Overview
Client Brief: The client requested the creation of a series of infographics to present various types of information in a visually appealing and easily digestible format. The infographics cover diverse topics including virtual reality, chocolate production, health tips, skincare habits, proactive living, and ocean depths. Each design aims to capture the essence of the topic while engaging the audience through effective visual communication.
Design Objectives:
- Present complex information in a clear and engaging manner.
- Use visually appealing graphics and color schemes that align with the subject matter.
- Ensure each infographic is unique yet maintains a cohesive style across the series.
- Make the infographics versatile for use in both digital and print formats.
Infographic Designs
-
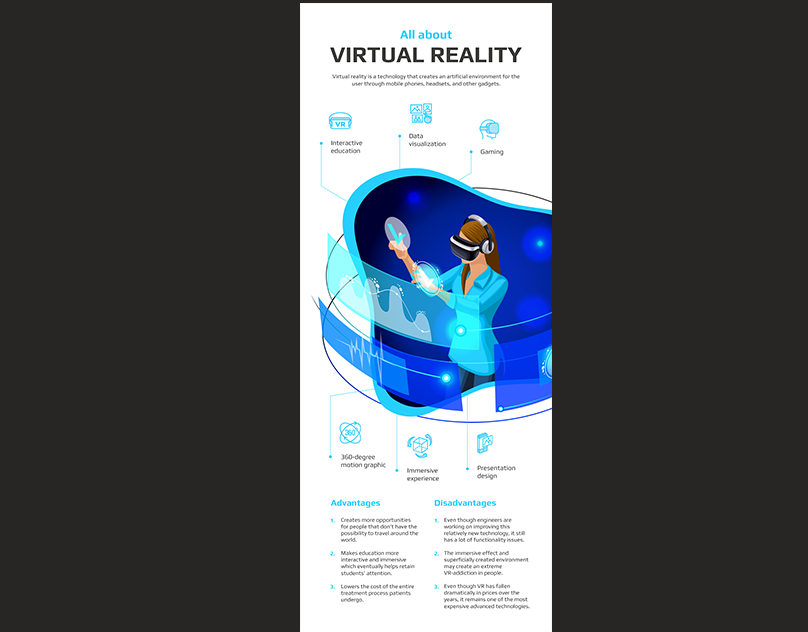
Virtual Reality:
- Theme: The future of virtual reality technology.
- Color Scheme: Cool blues and whites to evoke a sense of technology and innovation.
- Visual Elements: Futuristic graphics, icons representing different VR applications, and clean typography.
- Content Focus: Key statistics, benefits, and potential applications of virtual reality.
-
Chocolate Production:
- Theme: Chocolate production statistics and facts.
- Color Scheme: Rich purples and browns to reflect the colors of cocoa and chocolate.
- Visual Elements: Icons and charts depicting chocolate consumption, production processes, and major producers.
- Content Focus: Global chocolate production data, top producing countries, and fun facts.
-
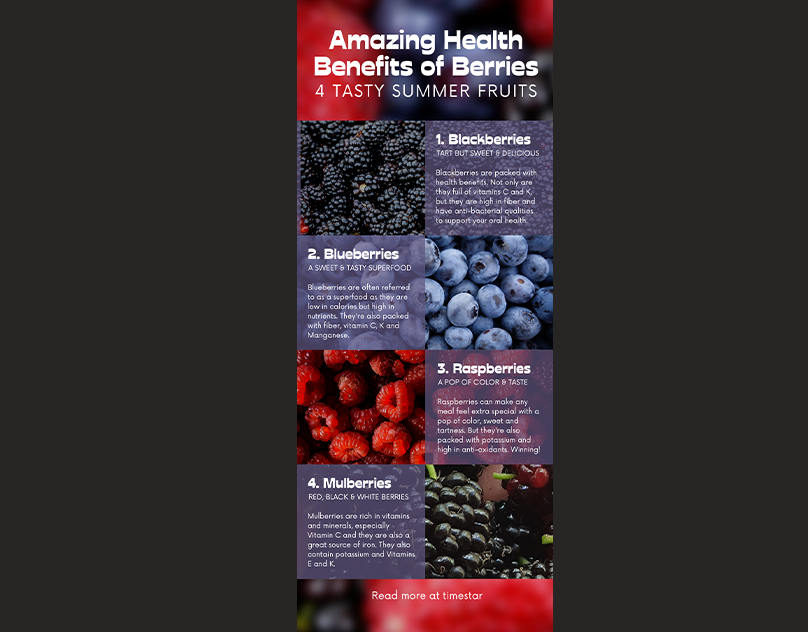
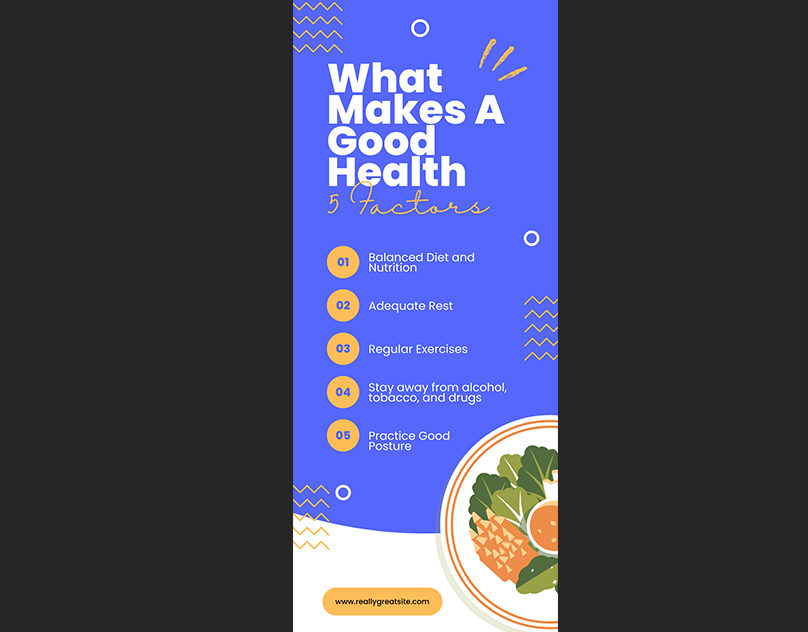
Health Tips:
- Theme: Tips for maintaining good health.
- Color Scheme: Bright blues and yellows to convey health and vitality.
- Visual Elements: Icons of healthy foods, exercise activities, and wellness tips.
- Content Focus: Practical advice for diet, exercise, mental health, and overall wellness.
-
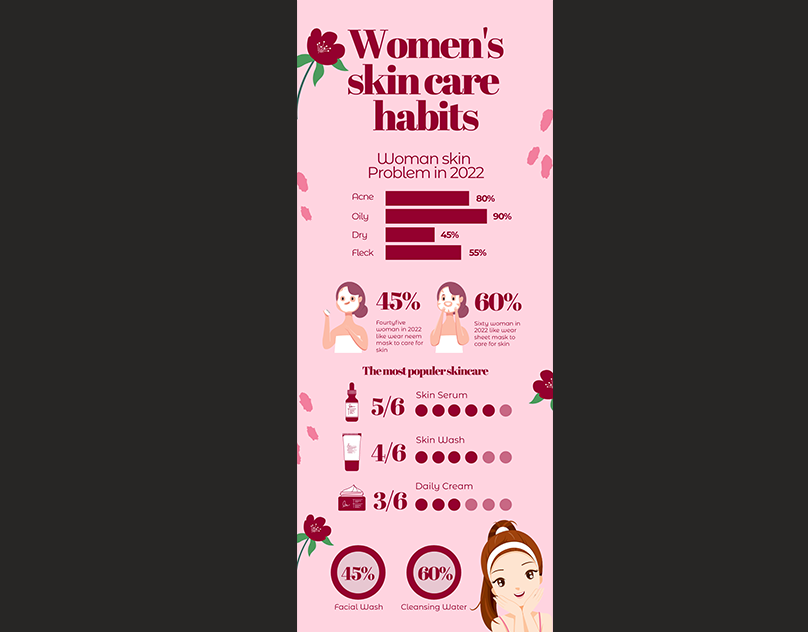
Women’s Skincare Habits:
- Theme: Survey results on women’s skincare routines.
- Color Scheme: Soft pinks and reds to evoke femininity and beauty.
- Visual Elements: Illustrations of women, skincare products, and charts representing survey data.
- Content Focus: Popular skincare habits, product preferences, and demographic breakdowns.
-
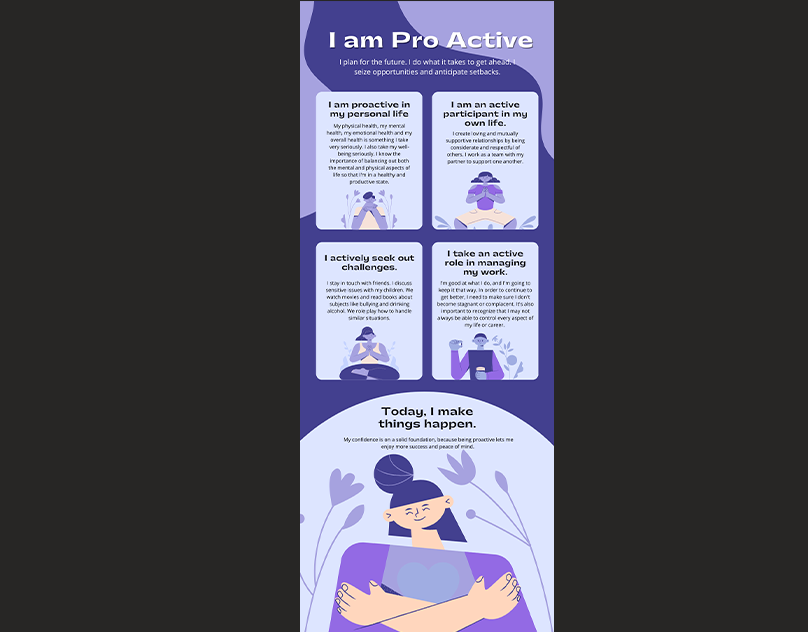
Proactive Living:
- Theme: Tips for leading a proactive lifestyle.
- Color Scheme: Calm blues and purples to represent balance and mindfulness.
- Visual Elements: Illustrations and icons related to proactive habits, mindfulness practices, and self-improvement activities.
- Content Focus: Strategies for proactive thinking, benefits of mindfulness, and daily routines.
-
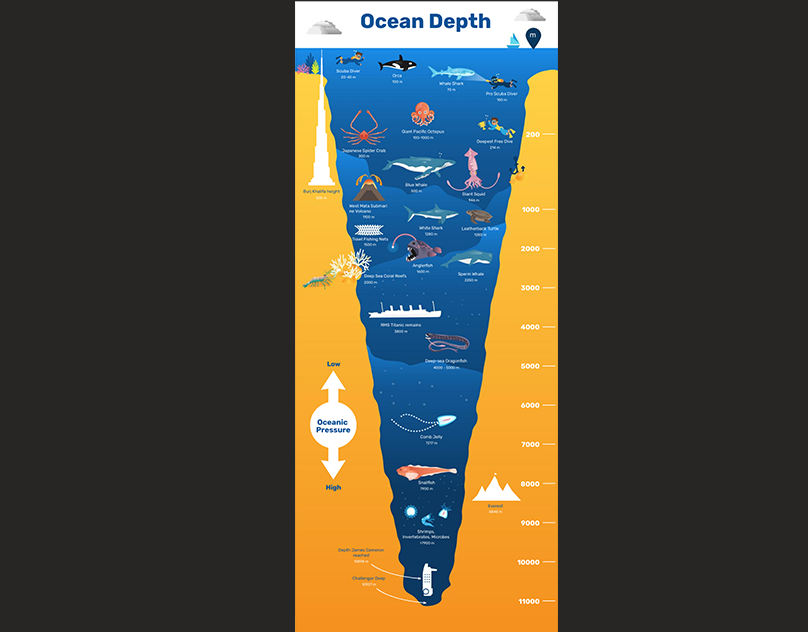
Ocean Depth:
- Theme: Exploration of the ocean’s depths.
- Color Scheme: Deep blues and earthy tones to represent oceanic layers.
- Visual Elements: Illustrations of ocean creatures, submarines, and depth markers.
- Content Focus: Different oceanic zones, notable marine life, and depth comparisons.
Design Process
1. Research and Planning:
- Extensive research was conducted for each topic to gather accurate and relevant data.
- Planning involved deciding on the most effective way to visualize the data and information.
2. Sketching and Layout:
- Initial sketches were created to outline the layout and flow of each infographic.
- Focus was on balancing text and visuals to ensure readability and engagement.
3. Digital Design:
- Using graphic design software, the infographics were developed with attention to color harmony, typography, and visual hierarchy.
- Icons and illustrations were custom-made to fit the theme of each infographic.
4. Feedback and Revisions:
- Drafts were reviewed and feedback was incorporated to refine the designs.
- Final adjustments were made to ensure clarity, visual appeal, and consistency across the series.
Application and Versatility
These infographics are designed to be versatile and can be utilized in various formats including:
- Digital Platforms: Websites, social media, online articles, and presentations.
- Print Media: Posters, brochures, flyers, and educational materials.
- Educational Use: Schools, workshops, and seminars for visual learning and engagement.
Service
Infographic Design
Project
Dynamic
Conclusion
This series of infographics successfully transforms complex information into visually engaging and easily understandable content. Each design is tailored to its specific topic while maintaining a cohesive aesthetic that ties the series together. This case study highlights the importance of thoughtful design and effective visual communication in creating impactful infographics.